Log Viewer Workspace
The Log Viewer workspace provides information on the user interface elements of the Log Viewer application.
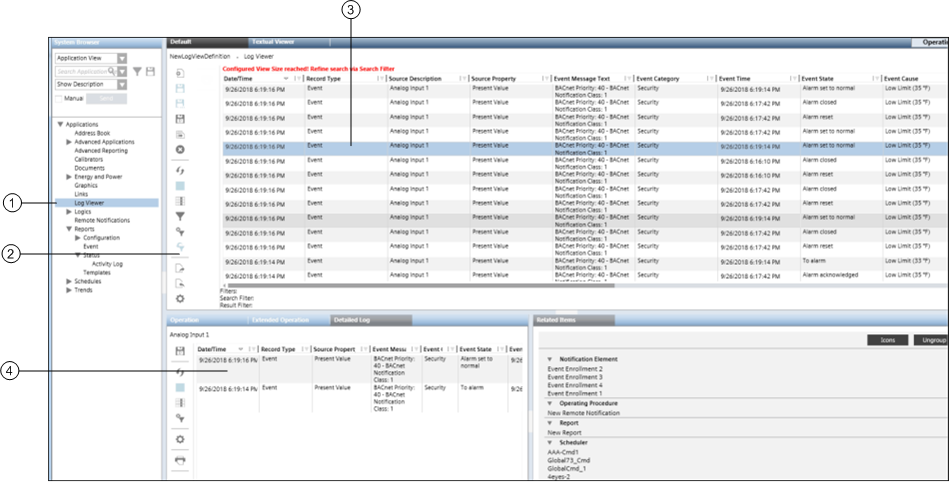
Log Viewer Workspace | ||
| Name | Description |
1 | System Browser | Displays all the saved Log View definitions in Application View > Applications > Log Viewer. |
2 | Contains buttons for performing various actions in Log Viewer. | |
3 | Log View | Displays the combined data from the Activity Log and Event Log. By clicking the drop-down arrow, a menu with the following options displays: |
4 | Displays information related to system activities and events. | |
The Log Viewer toolbar allows you to perform the following operations:
| Name | Description |
| Creates a new folder below the Log Viewer root node. | |
| Save | Saves a newly created and configured log view definition or changes in the configuration of the currently selected log view definition. |
| Save as | Saves the configuration of the currently selected log view definition as a new log view definition. |
| Save as Default | Saves the log view as a default template. |
| Saves the configuration of a log view definition such as search filters, column selection, sorting as a report definition. | |
| Deletes the currently selected log view definition or a folder below the Log Viewer root node. Deleting the folder also removes its contents. | |
| Refresh | Refreshes the data displayed in a log view definition, Log Viewer root node, or a log view folder. |
| Exports the log view definition and saves it in an xml file format. | |
| Imports a log view definition. | |
| Displays the Select Columns dialog box that allows you to select the columns to display in the log view. | |
| Displays the Search Filter dialog box that allows you to view a search filter condition and specify a filter condition on the columns that are not present in the log view. | |
| Remove all Result Filters | Removes all the result filters applied on the log data. |
| Returns to the previously applied search filter. | |
| Stop Execution | Stops the execution of a log view. |
| Configuration | Displays the Configuration dialog box that allows you to perform the following:
|
| Displays the Print dialog box that allows you to print the log data. |
The Select Columns dialog box allows you to add, remove, or reorder columns in a log view. You can access this dialog box using any of the following methods:
- Clicking the Select Column icon.
- Clicking the Select Column icon in the Detailed Log tab.
- Clicking the drop-down arrow on a column header and selecting the Select Column menu option.
- Right-clicking a column entry and selecting Select Column menu option.
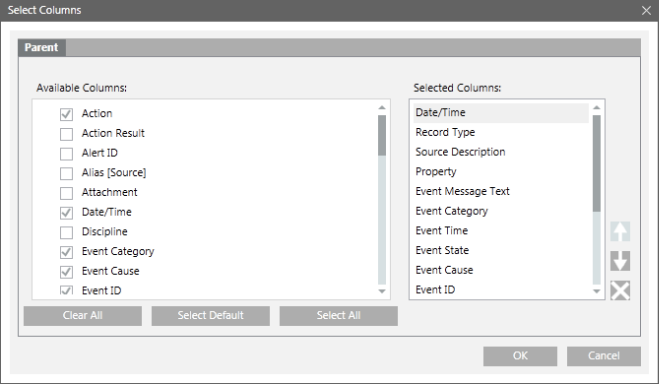
Select Columns Dialog Box Components | |
Name | Description |
Parent tab | Allows you to add, remove, or reorder parent columns in the log view. |
Available Columns | Displays all the columns associated with the log view. |
Selected Columns | Displays the default columns of a log view. You can add columns to the selected columns list by selecting the check box associated with each column in the Available Columns list. |
Select Default | Selects the default columns in the Available Columns list. |
Select All | Selects all the columns in the Available Columns list. |
Clear All | Clears all the columns in the Available Columns list. |
Move Up | Moves the selected column one step up in the Selected Columns list. The Move Up button is unavailable if you select the column on the top. |
Move Down | Moves the selected column one step down in the Selected Columns list. The Move Down button is unavailable if you select the column at bottom. |
Remove | Removes the selected column from the Selected Columns list. |
A custom filter allows you to define a filter expression from which you can filter data according to your specific requirements.
Custom Filter Condition
A custom filter condition is composed of:
- Column name (Condition Name)
- Operators
- Condition value
Examples of Custom Filter Expressions
The following list contains some valid custom filter expressions:
Event Category = "Life Safety"
Event Category = {“Status”; “Life Safety”; “Supervisory”}
The custom filter also allows you to create complex filters and conditions using mathematical and logical operators, and wildcard characters.
The following operators are supported:
Mathematical Operators | |
Enum Columns | Equal to (=), Not Equal to (<>) |
Numeric Columns | Equal to (=), Not Equal to (<>),Less than (<),Greater than (>),Less than Equal to (<=),Greater than Equal to (>=) |
Text Columns | Equal to (=), Not Equal to (<>), IN (←) |
Variant Columns | Equal to (=), Not Equal to (<>),Less than (<),Greater than (>),Less than Equal to (<=),Greater than Equal to (>=),IN (←) |
CNS Columns | Equal to (=) |
View Specific Columns | Equal to (=) |
Logical Operators | |
AND | Applying the custom filter expression on multiple columns. For example, 'Discipline' = "Building Automation" AND 'Subdiscipline' = "Access Control" |
OR | Applying the custom filter expression on the same column. For example, 'Discipline' = {"Building Automation";"Energy Management"} |
- Wildcard Character: Asterisk (*)
List of ENUM columns
- Subtype
- Type
- Subdiscipline
- Discipline
- Record Type
- Action Result
- Event Mode
- Event Category
- Event State
- Log Type
- Action
- Quality
- Previous Quality
Custom Filter Syntax
To create a custom filter, you must know the data type of the column for which you want to apply the filter.
The following examples should help you create custom filters without syntax errors.
- If column displays text data, for example string or enumeration, then the value must be enclosed within double quotes.
- ‘Source Description’ = “Analog Output 1”
- ‘Event Mode’ = “Normal”
- 'Value' = "True"
- 'Previous Quality' = "#COM"
- ‘User’ = “[DomainName]\\[UserName]”
- If column displays date time value, then the value must be in date time format configured in Windows on the server.
Date must be in the short date format, time in the long time format (24 hours). - ‘Date/Time’ = 3/13/2014 16:04:25 (assuming that the date format on the server is M/D/YYYY)
- 'Value' = 07/24/2014 11:52:00
- If column displays boolean data, such as TRUE or FALSE, the value must be enclosed in double quotes.
- 'Previous Value' = "True"
- ‘Value’ = “False”
- If column displays numeric data, for example, 54.11, 25, -20, and so on, then the values must be specified as follows:
- 'Value' = 54.11
NOTE: The decimal separator must be according to your Windows Regional and Language settings. - If column displays bit string, then the value must be enclosed in double quotes.
- ‘Quality’ = “Out of service”
- Specify time values in a 24-hour clock format. For example, to specify the Source Time as 2.00 PM, type 14.00.
Types of Custom Filters
There are two types of custom filters that are applied to the log data:
Result filter: The result filter enables you to filter data from the displayed data set in the log view. You cannot save a result filter condition.
In order to save the filter condition, you must move the result filter to a search filter and then save the configuration as a log view definition.
You can apply a result filter from the Custom Filter dialog box, Quick filter, Selection filter, and using drag-and-drop.
Search filter: The search filter enables you to obtain the data matching the filter expression from the database.
Any modification or addition to the search filter, refreshes the log view automatically, so that all the data matching the search filter is obtained from the database.
To preserve the search filters, you must save the settings as a log view definition. Using the search filter, you can filter the data for the columns that are present in the log view.
You can also apply a search filter if you need to filter the data for a column that is not present in the log view.
The combined search filter is always available in the Search Filter dialog box.
For example, you can apply a result filter on the log data to retrieve all records with Source Description as "Analog Input 1".
However, in order to save the filter condition, you must move the result filter to a search filter.
Custom Filter Dialog Box - For columns other than date/time
The Custom Filter dialog box allows you to define result and search filter expressions on a particular column. You can access this dialog box by either:
- Clicking the drop-down arrow on a column heading displaying non-date/time values and selecting Custom Filter.
- Right-clicking a log view entry displaying non-date/time data and selecting Custom Filter.
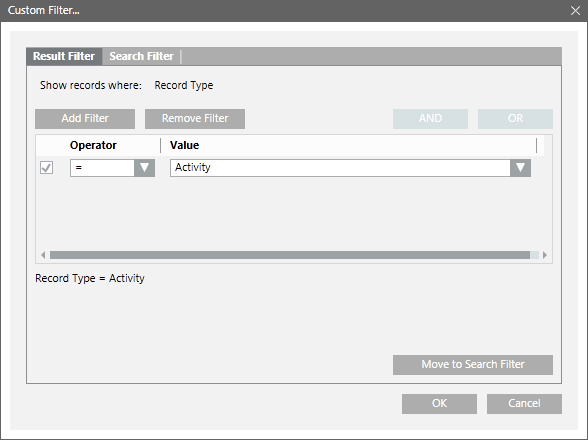

NOTE:
You can view records for only those event categories for which you have Show rights. In the absence of Show rights for any of the event categories, only Activity type records display.
Custom Filter Dialog Box Components | |
Name | Description |
Result Filter | Allows you to specify a result filter. |
Search Filter | Allows you to specify a search filter. |
Operator | Lists the mathematical operators. The list of operators displayed in this box depends on the column type. |
Value | Allows you to specify values. Depending on the column type, you can either select a value from the drop-down list or enter a value in the text field. |
Add Filter | Adds a new filter expression row with the Operator and Value fields to the Custom Filter dialog box. |
Remove Filter | Removes the filter set on the particular column. |
AND | This is a logical operator that allows you to combine filter expressions and create complex filters. This button is available only when you add a new filter expression row and select the check boxes preceding the Operator drop-down list in the filter expression rows. |
OR | This is a logical operator that allows you to combine filter expressions and create complex filters. This button is available only when you add a new filter expression row and select the check boxes preceding the Operator drop-down list in the filter expression rows. |
Move to Search Filter | Displays only when the Result Filter tab is selected. Allows you to move the result filter to a search filter. |
Filter expression field | Displays the filter expression. In case of multiple filter expressions, the OR operator is applied by default. |
Time Filter Dialog Box
This dialog box allows you to define result and search filter expressions on a particular date/time column. You can access this dialog box using any of the following methods:
- Clicking the drop-down arrow on a column heading displaying date/time values, positioning your cursor over Date Filters and then selecting Custom Filter.
- Right-clicking a log view entry displaying date/time data and selecting Custom Filter.
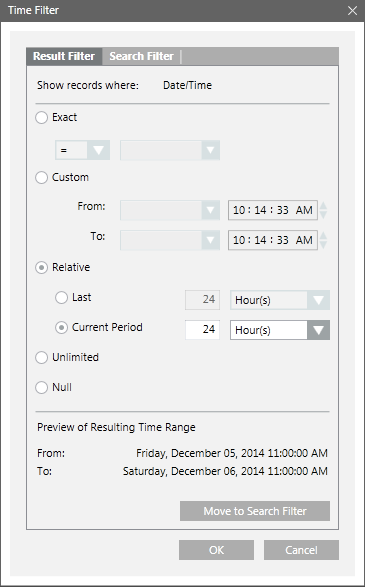
Time Filter Dialog Box Components | |
Name | Description |
Result Filter | Allows you to specify a result filter. |
Search Filter | Allows you to specify a search filter. |
Exact | Allows you to filter data based on the exact date specified. |
Custom | This option allows you to set the date and time as per your requirement. Selecting the Custom option enables the From and To fields. The To date should always be greater than From date. If the To date is less than the From date, then the To field is highlighted in red color and an error message displays when you move your cursor over the field. |
Relative | Relative has two options: Last and Current Period. |
Unlimited | Default selection. Allows you to retrieve all records. |
Null | Allows you to retrieve records with Null value. |
Move to Search Filter | Displays only when the Result Filter tab is selected. Allows you to move the result filter to a search filter. |
Preview of Resulting Time range | Displays the resulting time range for the options selected in the Time Filter dialog box. For example, if the present time is 08/07/2014 10.35 AM, then for the current 1 hour selection, the Preview of Resulting Time Range displays the following: |
The Search Filter dialog box allows you to view a search filter condition and specify a filter condition on the columns that are not present in the log view.
It also allows you to view, modify, and delete a combined search filter expression. You can apply the search filter on all columns except columns of type date and time.
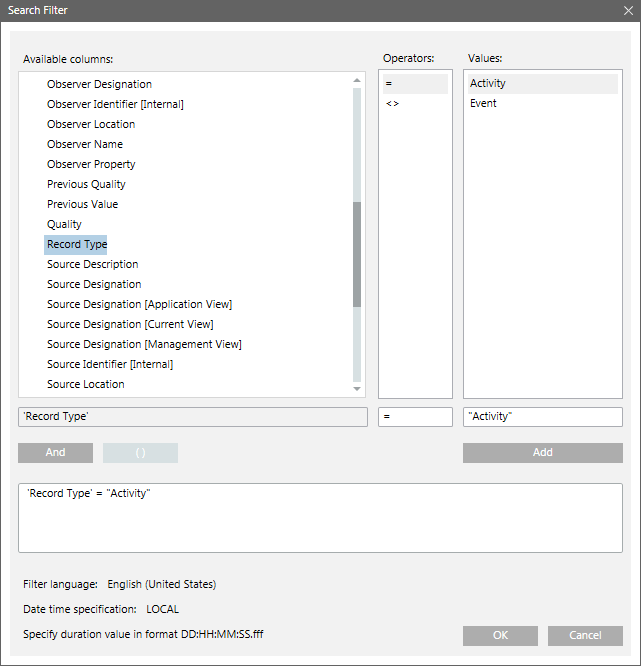
Search Filter Dialog Box Components | |
| Description |
Available Columns1 | Lists all the available columns from the Activities and Events Log. |
Operators1 | Lists all the operators associated with a specific column selected in Available Columns. |
Values1 | Lists all the values associated with a specific column selected in the Available Columns list. You can also select multiple values by pressing CTRL or SHIFT and selecting multiple values. |
Filter expression field | Displays the filter expression. You can edit a filter expression in this field. |
Add/Update | Allows you to add or update a filter expression. Update is enabled only when a valid filter expression is added or modified in the Filter expression field. |
And | This is a logical operator that allows you to combine filter expressions and create complex filters. This button is unavailable until a filter expression is added to the Filter expression field. |
"( ) " | Allows you to group filter conditions, which define the order of their evaluation. These brackets are unavailable until a filter expression is added to the Filter expression field. |
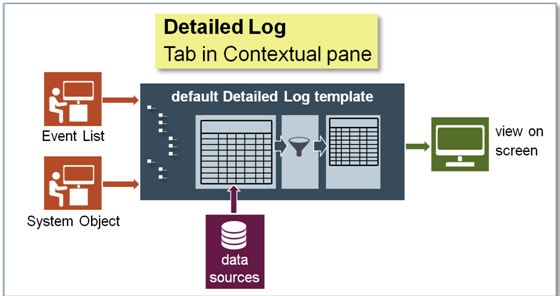
You can view information related to system activities and events through the Detailed Log tab.
The information displayed in the Detailed Log tab is related to the following:
- An object selected from System Browser: When you select an object from the System Browser, the Detailed Log tab displays the latest 100 activities for that object.
- An object is selected from any application, such as Graphics, Trends, Textual Viewer, or Reports:
If you select an object from any application, the Detailed Log tab displays the latest 100 activities and event log records for the object. - An activity or event type record is selected from the log view:
When you select an activity type record from a log view, the latest 100 activities and event logs for the selected object display in the Detailed Log tab.
However, if an event type record is selected, the details of the selected event including the different state changes of the event and the user activities performed in context of the event
are displayed in the Detailed Log tab of Event List, Investigative Treatment, and Assisted Treatment windows. - Event handling: When you select an event from the Event List, the details of the selected event including the different state changes of the event and the user activities performed
in context of the event are available in the Detailed Log tab of Event List, Investigative Treatment, and Assisted Treatment windows.
The Detailed Log tab however, does not display any information if you have selected more than one object.
You can customize the information displayed in the Detailed Log tab by
- Applying result filters on columns other than Date/Time
- Applying result filters on Date/Time columns
- Selecting columns to be displayed
- Hiding columns
- Sorting log entries
- Reordering and resizing Columns
By default, the following information displays for activity and event type data in the Detailed Log tab.

NOTE:
Values are displayed as per value scaled units (if configured). For more information, see Value Scale Units. You can view records for only those event categories for which you have Show rights.
Record Type - Activity | Record Type - Event |
Date/Time | Date/Time |
Source Property | RecordType |
LogType | Source Property |
Action Details | Event Message |
Action | Event Category |
Value | Event Time |
Previous Value | Event Cause |
Quality | Event ID |
Previous Quality | Value |
Unit | Unit |
Action Result | User |
User | Validation Profile |
Validation Profile | Object Version |
Audit Trail | Event Details |
Object Version | Category Priority |
Comment |
|
Reference Time |
|
Supervisor |
|
You can also save the settings in the Detailed Log tab as default template.
For example, you can create individual customized templates for displaying activity and event information by specifying the respective columns, their order and size, and by applying sorting on the data displayed.
Filters applied are not retained in the default template.
In a Distributed System, the Detailed Log tab displays the default template of the system that is associated with the currently selected object.
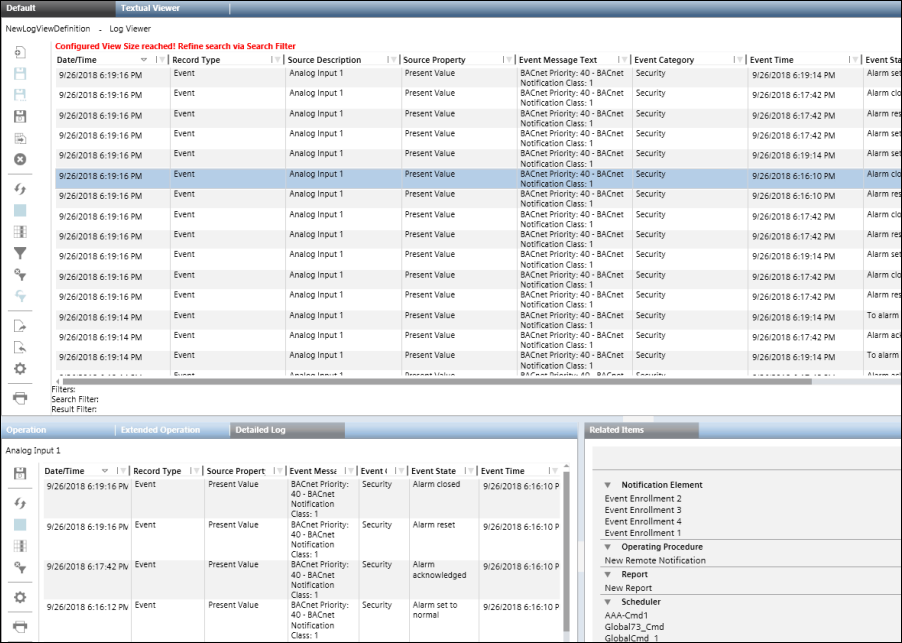
| Name | Description |
| Save As Default | Saves the selected columns in the Detailed Log tab as a default template. |
| Refresh | Refreshes the data displayed in the Detailed Log tab. |
| Stop Execution | Stops the execution of the log view in the Detailed Log tab. |
| Select Columns | Displays the Select Columns dialog box that allows you to select the columns to display in the Detailed Log tab. |
| Remove all Result Filters | Removes all the result filters applied to the log data in the Detailed Log tab. |
| Configuration | Displays the Configuration dialog box that allows you to display the date and time values in the Detailed Log tab till milliseconds. |
| Displays the Print dialog box that allows you to print the log data displayed in the Detailed Log tab. |


