Handling Events from Event List
The Event List window is your main starting point for dealing with events. From here you can get information about an event or its source, directly send event-handling commands, and initiate investigative or assisted treatment.

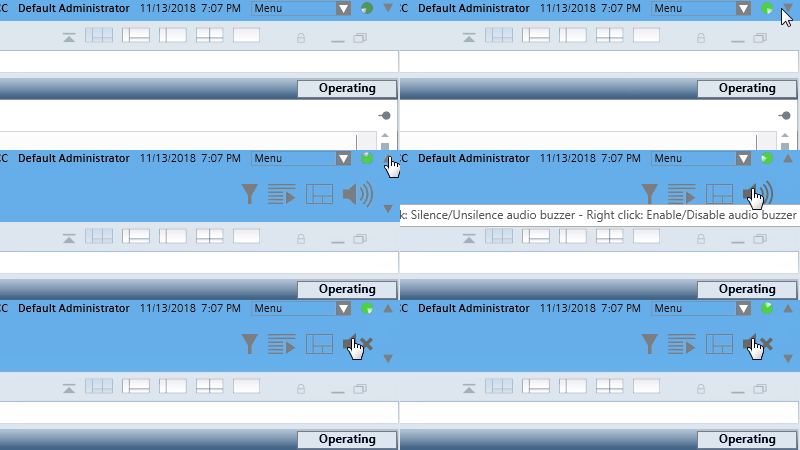
- An audio alert is active on your Desigo CC station.
- On the right-hand side of the Summary bar, click
 .
.
- The audio alert is silenced
 .
. 
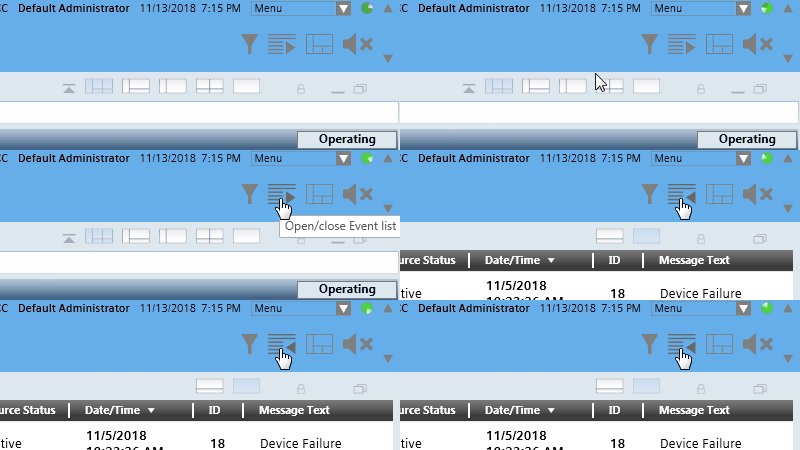
- The Event List window is not visible.
- On the right-hand side of the Summary bar, click Open Event List
 .
.
- Event List displays in the main work area of Desigo CC.

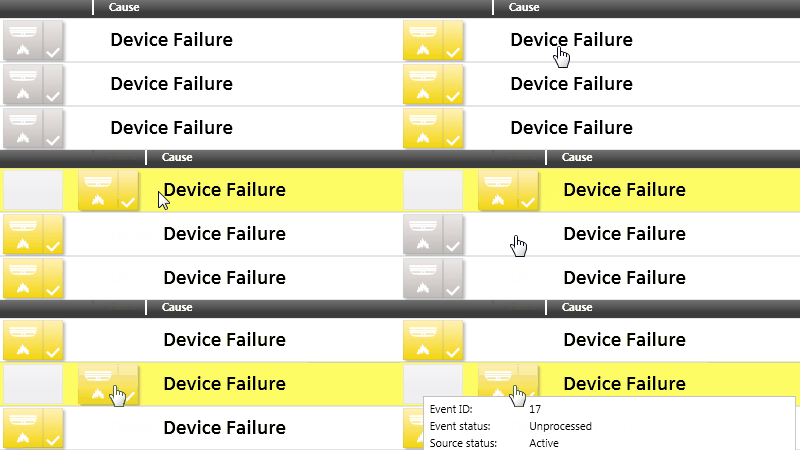
- Click the row of the event that you want to handle.
NOTE: In some Client Profiles, you can start sending commands directly without clicking on the event first to select it. In that case you can skip this step. Also, in some configurations, certain types of events autoselect when they occur, in which case you will not have to do this step.
- The event is selected, and its event descriptor becomes highlighted:
- The In process by field updates to indicate you are currently handling this event.
- If any other event was previously selected, it is automatically deselected (suspended).
- To perform a multiple selection, do one or more of the following:
- Press CTRL+A to select all the events in the list.
- Hold CTRL and click the event buttons one-by-one, to add events to the selection.
- Hold SHIFT and click the first and last event buttons of a range to add a contiguous set of events to the selection.
- To remove an event from the selection, press CTRL and click its event button.
- To deselect all the events in the selection, click the event button of any one of the selected events.
- A group of events is selected, and their event descriptors display highlighted. Any commands you issue will be sent to all the events for which that command is available.

From the event descriptor, use the icons in the Commands column to send any commands as they become available. The commands you must send will vary depending on configuration. A typical sequence may include:
- Click
 to acknowledge the event.
- After acknowledging the event, if the event caused a field panel to sound an audible alarm in the site, click
 to silence the panel, or click
  to turn it back.
- Click
 to reset the event.
- Click
 to close the event.

When no further commands are available, use the Event Status and Suggested Action columns to determine the next action you need to take. A typical sequence may include:
- Event Status =
Waiting for condition:
- Suggested Action =
Complete operating procedure. No further commands are available because you must first complete at least the mandatory steps of the operating procedure.
a. In the Information column, click Open related treatment to open the assisted treatment window.
b. Complete the operating procedure.
- Suggested Action =
Wait for condition. The event cannot be reset until the event source is back to normal.
a. You must correct the situation that caused the event or wait for the Source Status to return toQuietbefore you can send the remaining commands.
- Event Status =
Closed. You finished handling this event, and the event is ready to be cleared from the list. Click the event button again to deselect the event. It will then be removed from Event List.
You can do one or more of the following to get more information about an event or its source.
- View the inline information text:
a. In the Information column, click Show information text .
.
Any general information available about the event source displays here. Any other information provided in the Informational Text and Message Text columns is also repeated here.
b. Click the icon again to hide the information.
- Open the Contextual pane without leaving Event List:
a. In the Event List header, click the two-pane layout icon .
.
b. The Operation, Extended Operation, and Detailed Log tabs display at the bottom of the window. From here you can:
- Inspect the properties of the point that issued the event.
- View and execute any commands/actions available for that object.
- View a detailed log of the event currently being handled.
c. When you are finished, to hide the Contextual pane, click the splitter button , or click the single-pane layout icon
  .
.
- Jump to the event source in System Manager:
a. In the Source column, click the name of the event source.
b. System Manager opens with the event source automatically selected in System Browser.
c. Use Textual Viewer or Graphics Viewer to view details about the point that issued the event.
d. Use the Operation tab to view the properties of that object, and any commands available for it.
e. To go back to Event List, click Open Event List in the Summary bar.

- In the Information column this icon
 indicates that the object-dedicated text is available.
- In the Information column, click Show object memo
 .
.
- The object memo displays in the Text and Memo tab in the Contextual pane.
You can optionally log a note about the event in the history database.
- In the Information column, click Log an event note
 .
.
- In the Note Editor dialog box, enter the text of the note, and click OK.
- The note is stored in the History Database. If you selected multiple events, this note will be logged as applying to all those events. You can generate a report (Activity Log or Event Detail Log) to print any logged event notes.

You can interrupt the handling of an event at any time, for example, because a more important event has come in that you want to deal with right away.
- To interrupt handling of an event, do one of the following:
- Click the event button again.
- Select a different event in the list.
- The event is deselected and no longer appears highlighted. Its Event Status remains as it was when you interrupted handling the event. You can resume handling this event at any time by selecting it again.

When you have finished handling an event its Event Status changes to Closed. Depending on configuration, the event may be automatically cleared from the list. Otherwise:
- Click the event button again to deselect the event and clear it from the list.
